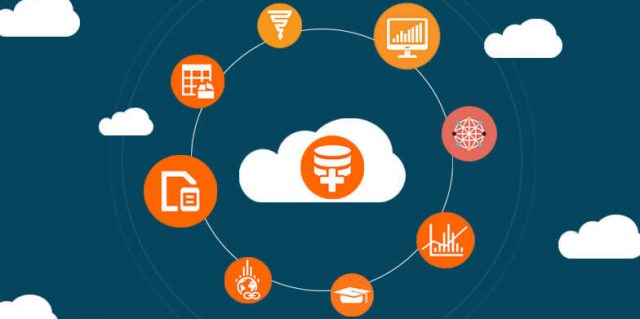
Data is an extraordinary tool. It can empower businesses to recognise trends, conduct analyses, make more informed decisions and foster growth and success. However, a business can have all of the data it needs and still fail if no one understands it.
In this day and age, businesses of all sizes are accumulating larger and larger amounts of data. However, if you don’t have a way of interpreting it, gathering enormous amounts of information isn’t much use. As a result, businesses everywhere are clamouring for a system that can analyse all of their data as well as make it simpler to comprehend. If you’re looking for such a tool, data visualisation may be the solution.
Using data visualisation tools such as Microsoft Power BI, large and small organisations alike can unearth trends and changes in the market and spot emerging patterns. Using visually immersive maps, charts and graphs, data visualisation can also assist businesses in understanding the meaning of the data by simply providing a visual context.
Power BI support is essential in helping businesses effectively implement and utilize these data visualization tools for maximum impact. With the right Power BI support, companies can seamlessly integrate their data sources, create custom reports and dashboards, and even collaborate with team members for a more comprehensive analysis.
There are a number of benefits of data visualisation, including making it simpler to understand the relationship between actions and outcomes which can assist a business in making informed, data-driven decisions.
So what is data visualisation? And does your business need it?
What is Data Visualisation?
Data visualisation is one of the most important services of any business intelligence (BI) and analytics solution. It allows businesses to visualise complex data in a visual format, such as a graph or chart, uncover trends that statistics alone may not readily disclose, and find hidden patterns.
Good data visualisation is storytelling. It helps to highlight patterns and reveal trends and outliers by curating information into a form that is easier to understand and analyse. It also removes any noise from data, highlighting just the important information, which is why is so much easier to understand than a traditional spreadsheet.
Effective data visualisation is a careful balancing act between form and function. The most compelling visualisation might completely fail to deliver what it needs to while the simplest graph could be too boring to capture anyone’s attention but make a powerful point. It takes skill to successfully combine analysis with storytelling – the facts and the images must work together.
The Benefits of Data Visualization
There are a number of benefits to consider when it comes to data visualisation. Data visualisation tools can assist your business in making informed, data-driven decisions that forge more strategic ways ahead. With greater access to data, you will also have a better understanding of your day-to-day operations and what areas within your business could do with improvement.
What’s more, by allowing every employee greater accessibility to data visualisation tools such as Microsoft Power BI, you’ll equip your entire business with the tools it needs rather than just a handful of employees or certain departments. Data visualisation tools allow employees to quickly access the data they need when they need it. This limits the likelihood of an employee making a decision without being informed, which makes it easier for your organisation to identify opportunities and make better decisions.
Other benefits of data visualisation include:
- Identify opportunities with emerging markets
- Enhance customer interactions, engagements and outcomes
- Gain more knowledge of consumer behaviour
- Boost productivity and efficiency
- Determine areas that require improvement within your organisation
- Increase response times
- Gain real-time access to crucial data and information
- Increase the management and visibility of daily business processes
- Communicate new business prospects and initiatives to key stakeholders in a way that highlights value
- Forecast and foresee potential outcomes based on existing business trends
- Automate data gathering, analysis and reporting
- Reduce expenses by precisely identifying and removing processes and services and/or products that are no longer profitable
- Giving staff members role-based access to the information they require
Does My Business Need Data Visualisation?
Why should you implement data visualisation techniques and tools in your day-to-day business operations? Because any kind of business benefits from making data easier to understand. Businesses are already benefitting tremendously from data visualisation. This is because patterns can be recognised and interpreted more efficiently in graphical or pictorial forms. At the end of the day, visualisation tools and technologies are essential for analysing massive amounts of information in the world of big data as well as making informed, data-driven decisions.
What is the Best Data Visualisation Tool?
One of the very best data visualisation tools is Microsoft Power BI. Innovative, dynamic and forward-thinking, the platform allows your business to quickly connect to data, prepare it, model and visualise as much or as little as you like, before securely sharing insights both internally between departments and teams, and externally to stakeholders and clients alike.
Power BI can connect to data located in-house, in the cloud, on social media and other crucial marketing integrations. Users can also simultaneously connect to hundreds of data sources, which in turn allows for the construction of fresh visualisations which can be utilised to gain fresh insights.
Final Thoughts
In conclusion, data visualisation is the process of putting data into an immersive visual framework for the purpose of making it easier to understand, draw conclusions and make informed, data-driven decisions. It’s also a helpful mechanism for tracking patterns and emerging trends, as well as finding outliers in enormous sets of data.
The underlying idea behind data visualisation is that conclusions must be drawn from data that has been visually represented before an analysis can be done properly. Data visualisation tools such as Microsoft Power BI allow large and small businesses alike to comprehend what the information actually means by giving it a visual context. This can help with the implementation of data-driven strategies and campaigns as well as guide the decision-making process.
Follow Technoroll for more!
Editorial Staff of the TechnoRoll, are a bunch of Tech Writers, who are writing on the trending topics related to technology news and gadgets reviews.


